
- This event has passed.
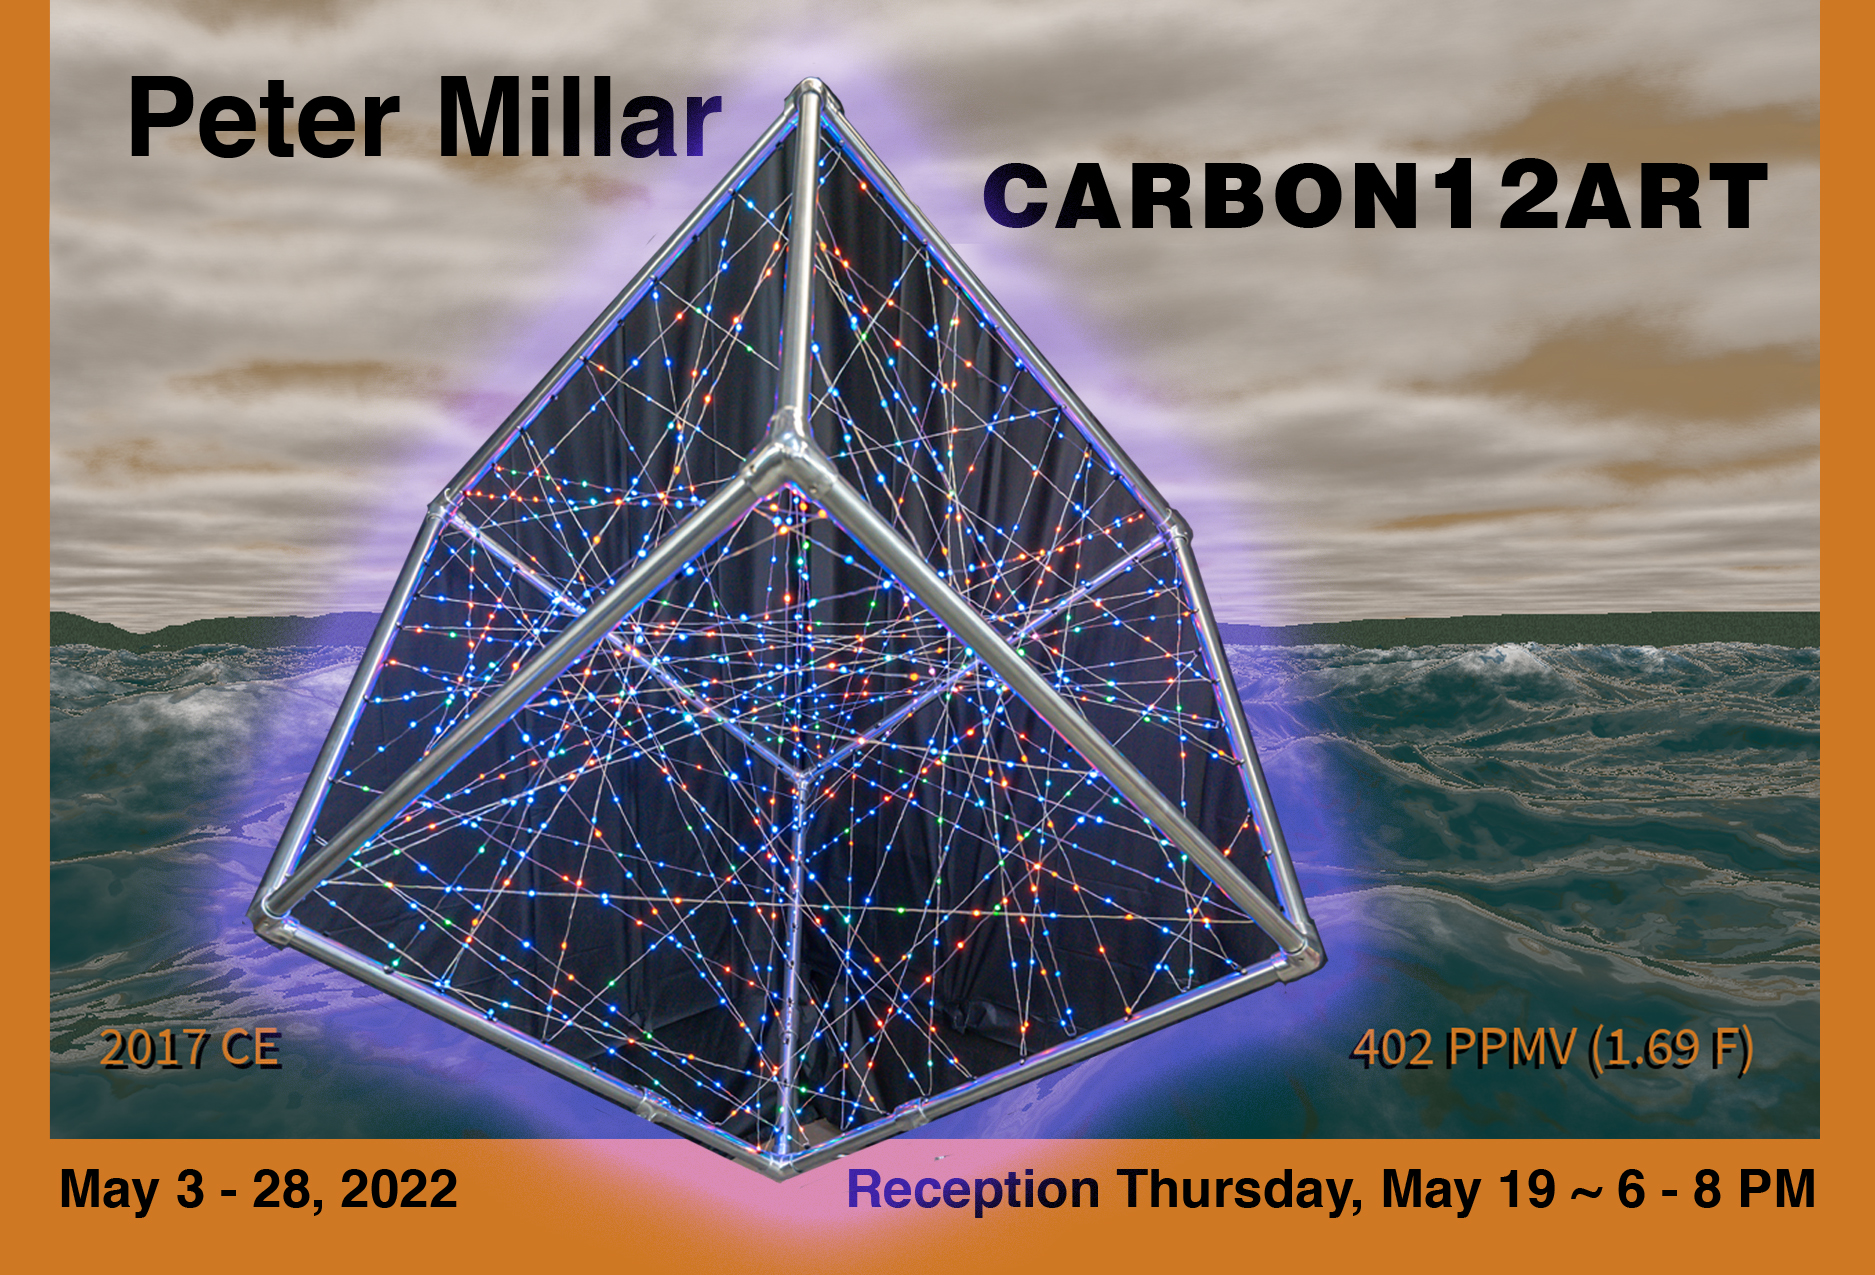
Peter Millar – CARBON12ART
May 3, 2022 @ 8:00 am - May 28, 2022 @ 5:00 pm
Exhibition Dates – May 3rd thru May 28th
Reception Dates – Thursday, May 19th, 6 to 8 pm
Shedding Light on Climate and Sky (SLCS) explores the intersection of art, science, learning and culture. It looks at the structure and systems of the physical world and explores how people relate to it through ideas, metaphor, concepts, intellectual and physical models. It illustrates timelines and quantities, the vast range of sizes and numbers, and beautiful complexities of things on Earth.
SLCS directly explores how much carbon is in the air, how we can see it, and how it has changed over time. I am interested in showing how carbon can be seen and understood, and how much power and change it reflects in the climate system and life on Earth. The work is interactive, deeply visual, quantitatively accurate and aimed at being directly educational.
To the point of Climate Change and Carbon –
Most people are aware of climate change. They know that carbon emissions are a major cause of climate change. The thing that most people are not aware of is just how much carbon is actually in the air. What does it look like? And how has it changed over time? You cannot see carbon dioxide molecules floating in the atmosphere.
SLCS includes LED sculptures, demonstration models, and data-driven video graphics that comprise a teaching installation that shows us how much CO2 is really in the air. It beautifully and accurately demonstrates how much carbon is in the air. It traces back as far as there are records and moves through time, up to the present.
The main focus of the installation is a one cubic meter frame with one thousand led lights. The frame contains one million cubic centimeters. Each light in the frame represents one part per million. Blue lights are normal air. Red lights represent carbon. The mix of colored lights changes according to the date chosen by the viewer.
The data driving the lighting changes are from real ice-cores taken in Antarctica and more recently from surface measurements taken from all over the Earth. A timeline can be selected beginning as far back as the earliest ice ages to the present. Specific dates, CO2 levels, and time sequences can be chosen on a control console. The speed at which a sequence may be run is adjustable. Thus, the complete 800,000-year dataset can be run in a very short time period to allow the viewer to see the overall changes.
In addition to the cube, we have three video representations of atmospheric carbon, total atmospheric energy, and temperature changes. One setting is a beach scene. The turbulence and power of the waves and the cloud cover are driven by the carbon concentration. The scene changes as carbon levels change through time. Other scenes include a dynamic particle simulation and real-time graphing of the data. To round out the show, a number of other installation pieces teach about CO2, how we measure it, how we look at it, and what its effects are.
